| Project: Norwegian Wind Atlas | Customer: NVE/ENOVA | Revision: 2.0.0 | ||||||
| Layout: Finnmark east offshore 3 | User: VECTOR AS | Date: 18.08.03 11:12 | ||||||
| + | Wind Resources in Finnmark east offshore 3 |
| Possible use of shallow areas along the Norwegian coast for wind energy production depends on the water depth, distance to shore and the annual mean wind speed. These variables can be explored by clicking on the link icons in the below figure. | |||||||
| . | |||||||
| . |  |
. |
|
. | |||
| . | |||||||
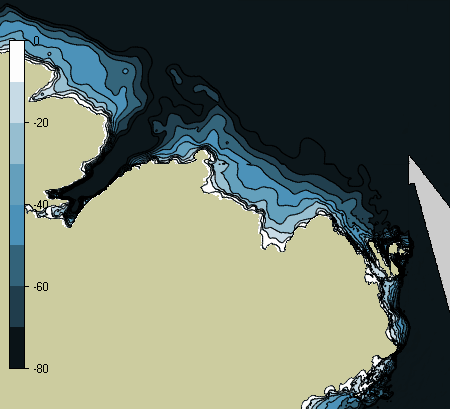
| Fig. 1 | Bathymetry data (m), depths below -80 meters are not presented. Areas where bathymetry data is not available are presented as grey polygons. Model extension UTM zone 33, EUREF 89: x_min = 1050000 x_max = 1105000 y_min = 7870000 y_max = 7920000 | ||||||
| Area classification | ||||||||||||||||||
| In this model the shallow offshore areas with depths less than -50 meters cover: 274 km 2. Shallow areas are further classified in 5x5 groups according to distance to fixed point and according to water depth. A fixed point is defined as any point in an island that has a minimum area. The minimum island area is set to: 1.0 km 2. | ||||||||||||||||||
| . | -10 m | . | -20 m | . | -30 m | . | -40 m | . | -50 m | . | ||||||||
| 10 km | 38 | (1775) | 77 | (3648) | 124 | (6017) | 189 | (9240) | 274 | (13519) | ||||||||
| 20 km | 38 | (1775) | 77 | (3648) | 124 | (6017) | 189 | (9240) | 274 | (13519) | ||||||||
| 30 km | 38 | (1775) | 77 | (3648) | 124 | (6017) | 189 | (9240) | 274 | (13519) | ||||||||
| 40 km | 38 | (1775) | 77 | (3648) | 124 | (6017) | 189 | (9240) | 274 | (13519) | ||||||||
| 10000 km | 38 | (1775) | 77 | (3648) | 124 | (6017) | 189 | (9240) | 274 | (13519) | ||||||||
| Table 1. |
Areas in km2 classified in groups according to water depth and distance to fixed point,
number in brackets are the energy production in GWh/year for an installed capacity of 15MW/km2
|
|||||||||||||||||